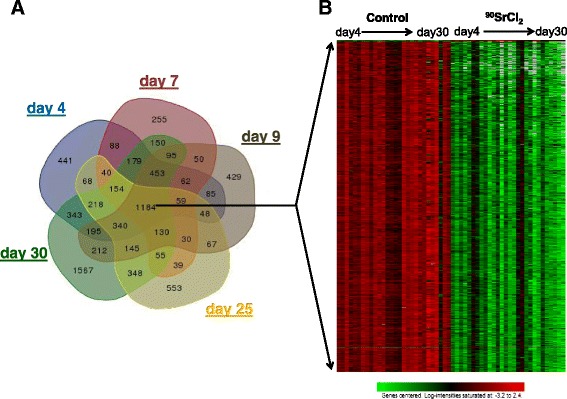
Fig. 2.

Summary of microarray gene expression results in blood cells after 90Sr injection. a Venn diagram of differentially expressed genes at each time point showing numbers of genes overlapping between time points (the Venn diagram was generated using the online tool at bioinformatics.psb.ugent.be/webtools/Venn/). There were 1184 genes that were common to all time points. b Heatmap of expression of the 1184 genes common across the study revealed that the majority of genes (1180 out of 1184) were down regulated rapidly after 90Sr injection, and stayed repressed throughout the study
