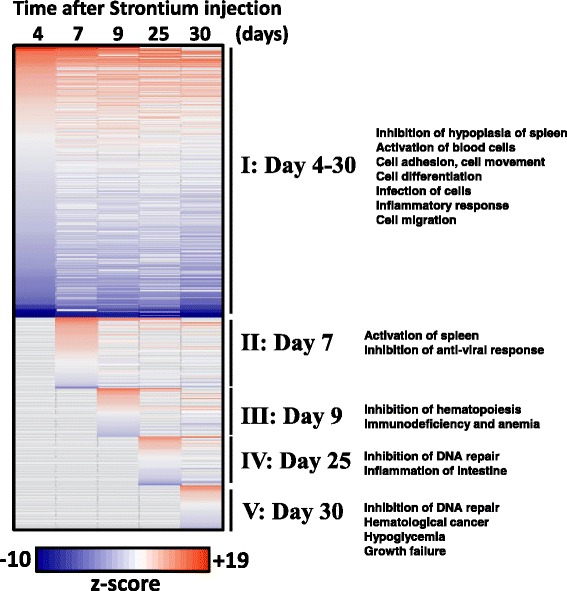
Fig. 3.

IPA based enrichment of biological functions; the heatmap shows the top scoring biological functions across the study. Each column indicates z-scores corresponding to enriched biological terms for the set of differentially expressed genes at the time indicated after 90Sr injection. Columns were sorted by significant processes from early (day 4, group I) to late (day 30, group V), in the study. Group I included processes that were affected across the study. Group II processes were affected starting on day 7; Group III processes, on day 9; Group IV, started at day 25, and Group V were significant only at day 30 in the study. The colors of the cells indicate z-scores, potentially activated/promoted processes (varying shades of orange) and potentially inhibited/suppressed processes (varying shades of blue); in each case increasing darkness of color represents increasing significance. Processes that did not appear in the core analysis result are shown in gray. The complete table with scores is in Additional file 4
