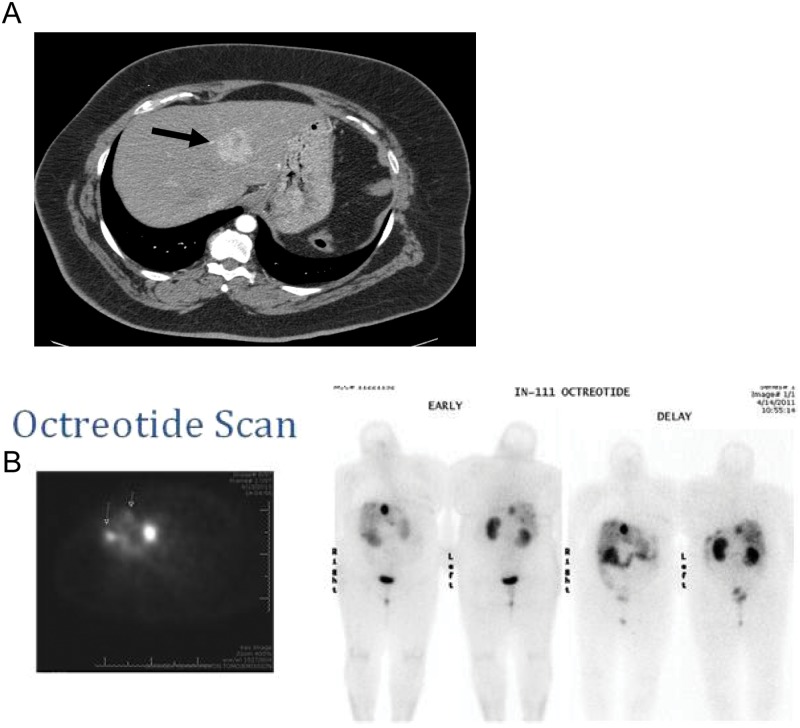
Figure 3.
(A) Contrast-enhanced CT of the abdomen/pelvis (date: April 13, 2011) showed a dominant left lobe mass (arrow). Smaller liver lesions were also present (not shown). (B) Octreotide scan (date: April 14, 2011) showed a focus of intense uptake in the right lobe of the liver consistent with neuroendocrine metastasis, and numerous additional smaller foci of increased uptake are noted in the liver consistent with metastatic disease (small arrows)

