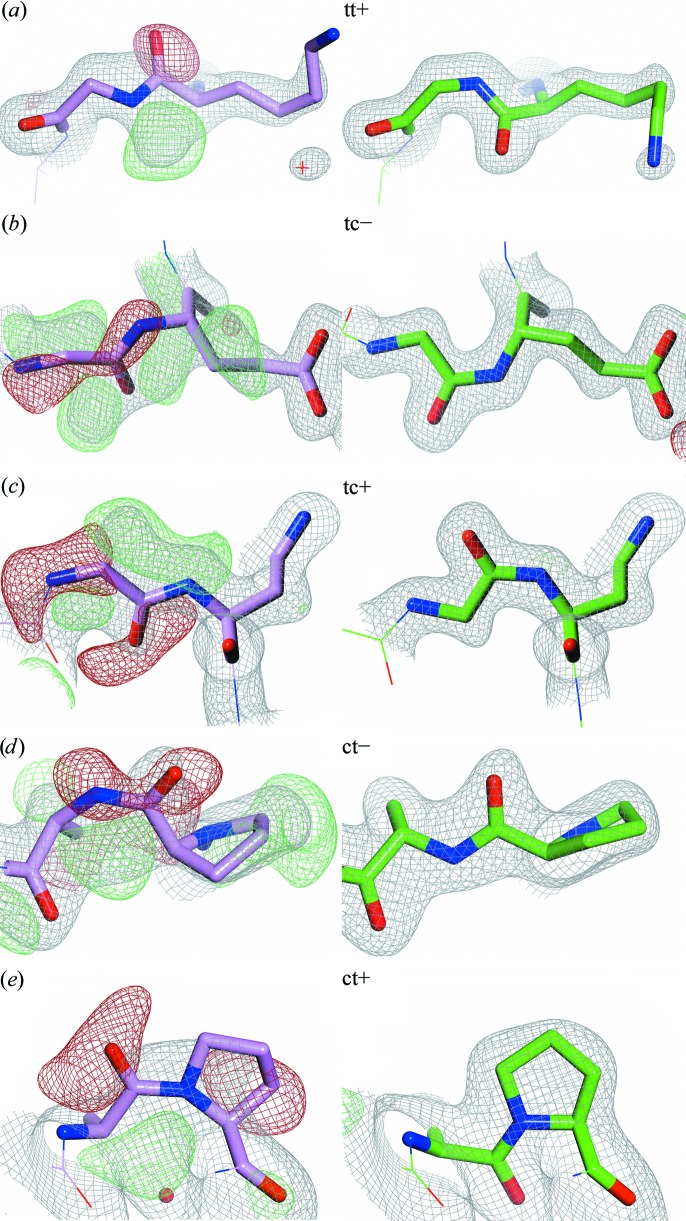
Figure 1.
Representative peptide flips. The left figures show the peptide conformation found in the PDB (pink structures) and electron-density maps obtained from the Uppsala Electron Density Server (Kleywegt et al., 2004 ▸). The figures on the right show the conformation and electron density of the corresponding re-refined structure models (green) from the PDB_REDO databank (Joosten et al., 2011 ▸). The flip type is indicated (tt− and cc− are not flips and thus are not illustrated). A cc+ example could not be found in the PDB. (a) Gly90, chain A, PDB entry 3hr7 (Cheng et al., 2012 ▸), 1.8 Å resolution. (b) Glu175, chain C, PDB entry 3k2g, 1.8 Å resolution. (c) Gln541, chain A, PDB entry 1w0o (Moustafa et al., 2004 ▸), 1.9 Å resolution. (d) Ala82, chain A, PDB entry 1v6i (Kundhavai Natchiar et al., 2004 ▸), 2.15 Å resolution. (e) Pro55, chain B, PDB entry 1j1j (Sugiura et al., 2004 ▸), 2.2 Å resolution. The PDB_REDO program pepflip (Joosten et al., 2011 ▸) performs tt+ peptide-plane flips, which are a combination of both a C=O flip and an N—H flip. Re-refinement alone can lead to N—H flips (tc− and ct− flips) when the signal in the X-ray data is strong enough. Therefore, the net result of a tt+ flip and subsequent refinement may become a tc+ flip. Consequently, PDB_REDO is able to correct many (but certainly not all) peptides in need of a trans–cis flip. The 2mFo − DF c (grey mesh) and mFo − DF c maps (+, green mesh; −, red mesh) have been contoured at 1.5σ and ±3σ, respectively, and have been rendered with a grid size of 0.2 Å for visualization purposes. The figures were prepared with CCP4mg (McNicholas et al., 2011 ▸).

