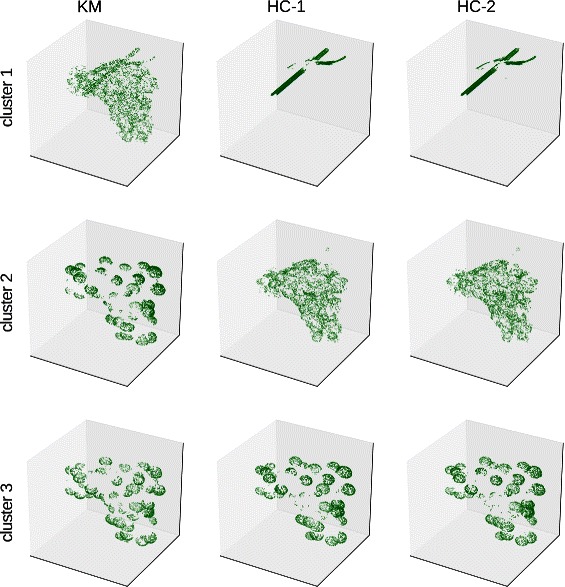
Fig. 3.

Example for clusterings of the grapevine dataset (berry and rachis) using Algorithm 1 and with different data mappings (k=3). For each cluster a subset of points are illustrated, containing the most histograms located on the rachis and parts containing the berry surface and the inner parts of the fruit
