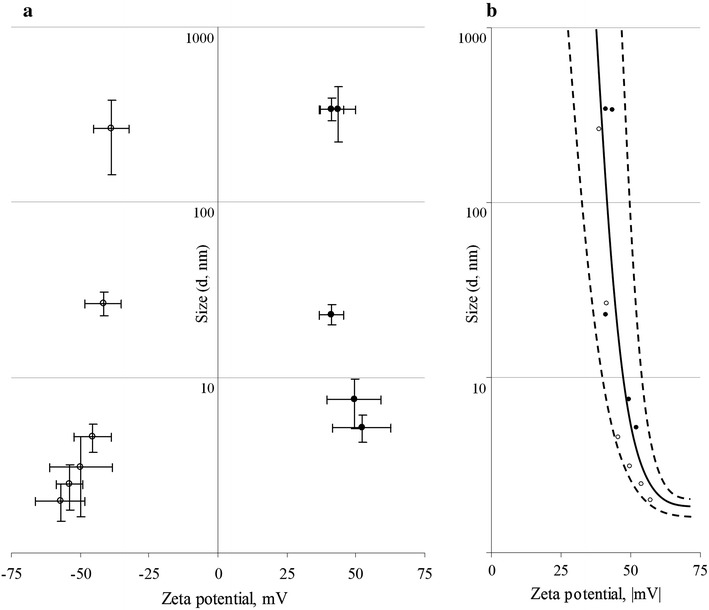
Fig. 2.

The graph illustrates distribution of particles size and zeta potential values of [60]fullerene derivatives in aqueous suspension. Data analysis with (a) and without (b) the negative and positive sign of the particles’ surface charge. White circles negatively charged compounds; black circles positively charged compounds.
