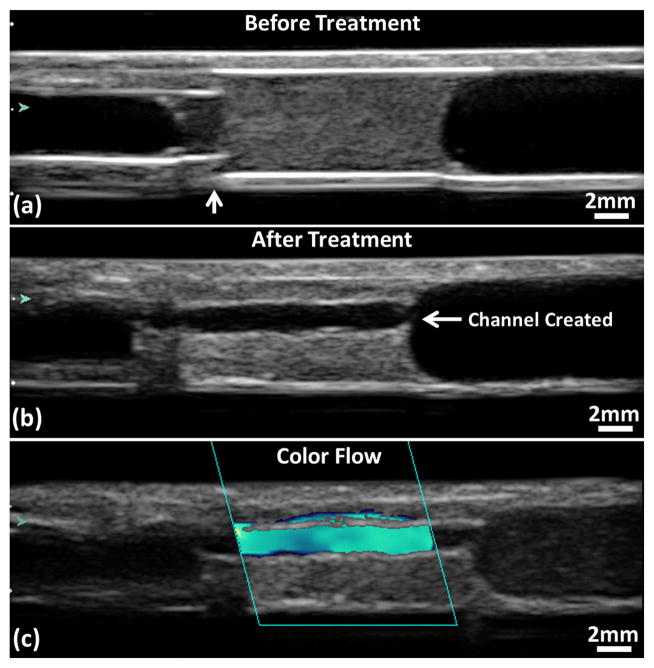
Figure 8.
Ultrasound images of a treated clot in the vessel phantom. (a) Before treatment. The vertical arrow shows where the stenosis is. (b) Flow channel presents after treatment. (c) Color flow presents after treatment. Glass beads (Part# 10089; TSI, Shoreview, MN, USA) were mixed in the perfusion saline after the treatment to obtain this color Doppler image. Flow is from the right to the left of the images.

