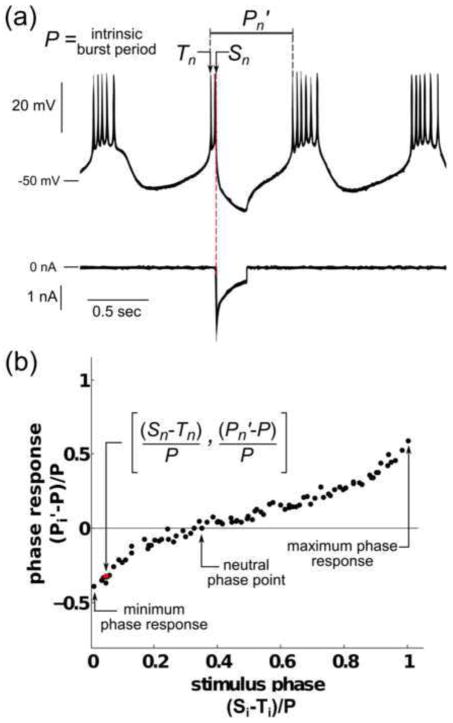
Fig. 2. The phase resetting curve in a regular bursting neuron.
(a) Voltage trace (top) of a biological PD neuron with intrinsic burst period P, and current trace (bottom) of injected artificial synaptic input. At time Sn, a pulse of artificial inhibitory synaptic input (100 nS) is given, resulting in the perturbed period Pn′. (b) PRC obtained from the PD neuron shown in (a). The ith stimulus phase, defined as the time from the beginning of the last burst, Ti, to the stimulus time, Si, normalized by P, is plotted on the x-axis. The phase response, defined as the difference between the perturbed period Pi′ and P, normalized by P, is plotted on the y-axis. The phase response at i=n is highlighted in red. The minimum and maximum phase responses and the neutral phase point are labeled on the plot

