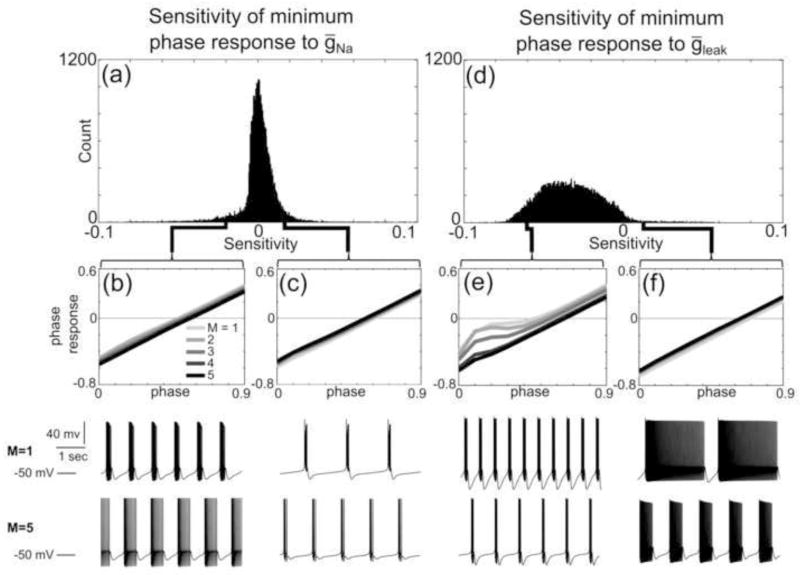
Fig. 8. Conductances can either increase or reduce the PRC minimum phase response.
(a) Histogram of sensitivities of minimum phase response of PRC families to ḡNa. (b) Example of a five-member PRC family with minimum phase responses that decrease with increasing ḡNa. All PRC family members are shaded from light to dark, with the lightest PRC having the lowest ḡNa value and the darkest PRC having the highest ḡNa value. ḡNa values of the model neurons corresponding to each PRC are given by multiplying the integer M by 100 mS/cm2. The spontaneous activity patterns of the model neurons with the smallest (M=1, top) and largest (M=5, bottom) ḡNa values in the family are shown below the PRCs. (c) Example of a five-member PRC family with minimum phase responses that increase with increasing ḡNa. (d) Histogram of sensitivities of minimum phase responses of PRC families to ḡleak. (e) Example of a five-member PRC family with minimum phase responses that decrease with increasing ḡleak. ḡleak values of the model neurons corresponding to each PRC are given by multiplying the integer M by 0.01 mS/cm2. The spontaneous activity patterns of the model neurons with the smallest (M=1, top) and largest (M=5, bottom) maximal ḡleak values in the family are shown below the PRCs. (f) Example of a five-member PRC family with minimum phase responses that increase with increasing ḡleak

