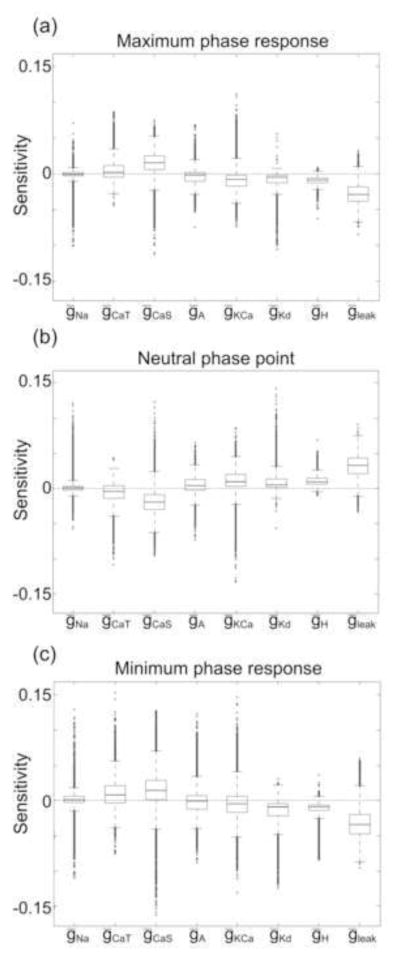
Fig. 9. The sensitivity of PRC families to specific conductances varies throughout conductance space.
Box plots indicating the spread of the sensitivities for all families of PRCs for “PD-like” model neurons. The bold, central lines in each box plot indicate the median sensitivity of the (a) maximum phase response, (b) neutral phase point, and (c) minimum phase response to each conductance. The lower and upper edges of each box indicate the 25th and 75th percentiles, respectively, and the whiskers (dashed black lines) extend to the furthest data points that are within 1.5 times the interquartile range (the difference between the 75th percentile and the 25th percentile). All data points beyond 1.5 times the interquartile range are indicated as open ovals. Both negative and positive sensitivities exist for all conductances

