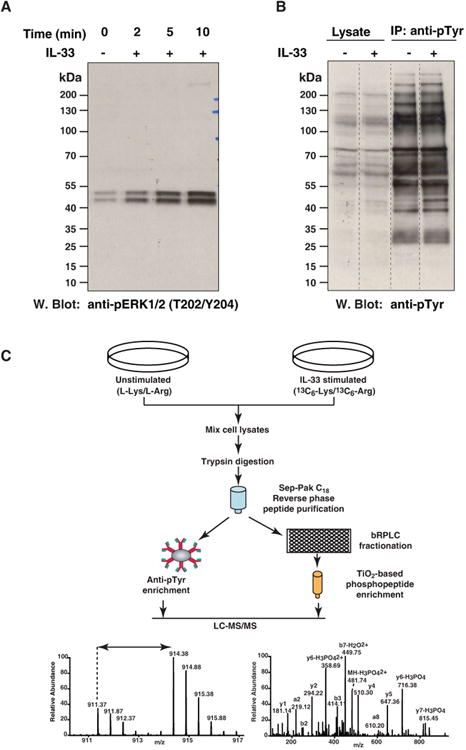
Figure 1. IL-33-induced phosphorylation.

(A) Dose and time-dependent response to IL-33 stimulation. RAW264.7 cells were stimulated with 100 ng/ml IL-33 for the indicated times and cell lysates resolved by SDS-PAGE. Phosphorylation of Mapk1 and Mapk3 was probed by Western blotting with antibody that recognizes p-Mapk1 (T183/Y185) and p-Mapk3 (T203/Y205). The amount of total MAPK1 and MAPK3 were determined by reprobing the membrane with anti-MAPK antibody.
(B) Phosphotyrosine profile of IL-33 stimulated RAW264.7 cells was compared with that of unstimulated cells by Western blotting with an anti-phosphotyrosine antibody.
(C) Outline of the experimental strategy. RAW264.7 cells were cultured in “light” or “heavy” SILAC medium. The cells grown in heavy medium were stimulated with IL-33 for 10 min and the cells grown in light medium were left unstimulated. The samples were subjected to trypsin digestion and enriched for phosphopeptides using two approaches. One part of the peptide mixture was incubated with antiphosphotyrosine antibodies for enrichment of tyrosine-phosphorylated peptides. The other part was fractionated by bRPLC and phosphopeptides were enriched using TiO2 beads. The enriched phosphopeptides were analyzed by LC-MS/MS. The resulting high resolution mass spectra reveal IL-33-induced changes in the phosphorylation status on each site.
