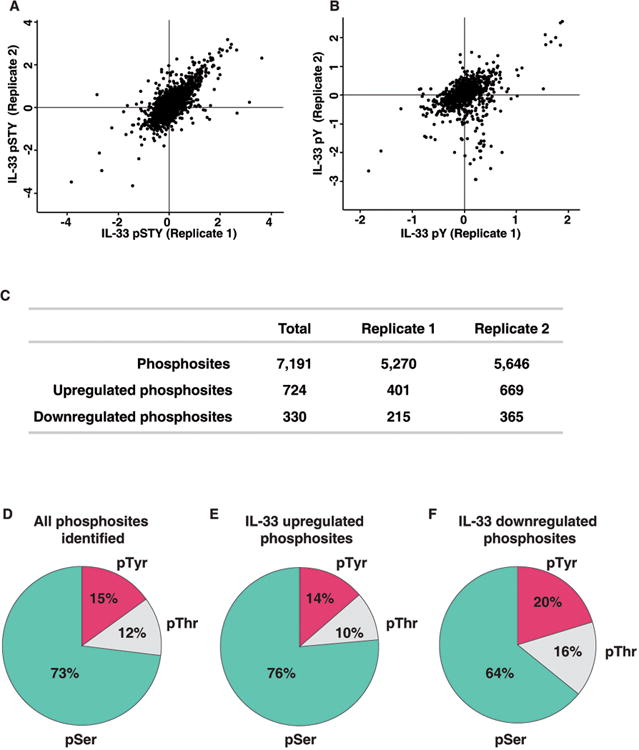
Figure 2. Summary statistics of the analysis.

Correlation of the normalized SILAC ratio between replicate measurements of TiO2-based phosphopeptide enrichment (A) and anti-phosphotyrosine antibody enrichment method (B) (C) Summary of the number of phosphopeptides and class I phosphorylation sites that were identified and quantified in the two biological replicates.
(D) Distribution of pSerine, pThreonine and pTyrosine containing peptides.
(E) Distribution of pSerine, pThreonine and pTyrosine containing peptides in IL-33-upregulated phosphopeptides.
(F) Distribution of pSerine, pThreonine and pTyrosine containing peptides in IL-33-downregulated phosphopeptides.
