
Fig. 1.
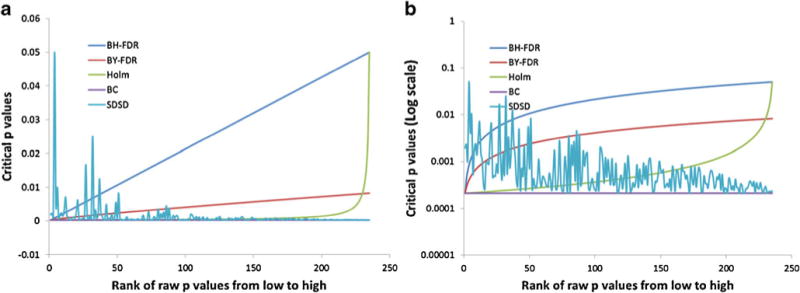
a Graphical representation of critical p values as a function of p value rank order. The standard BC is depicted as a constant line (purple) whose critical p value is independent of p value rank. The BH-FDR and BY-FDR results are depicted in blue and red, respectively. The Holm’s correction is shown in green. b Critical p values are plotted using a log scale to highlight differences among the various methods