
Fig. 2.
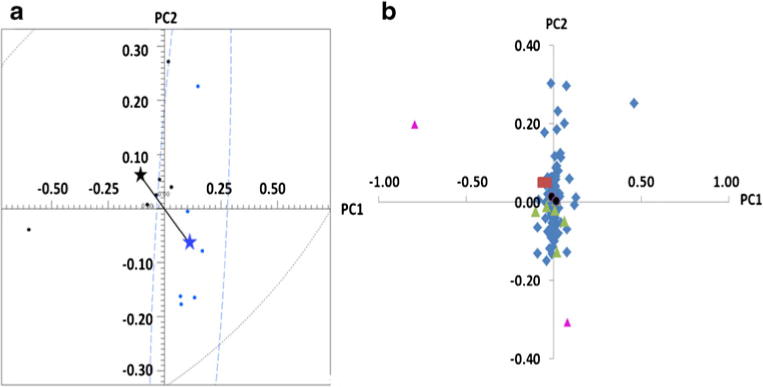
PCA analysis of the group C versus group V comparison. a PCA scores plot and b PCA loadings plot. Red squares are significant by all three methods: BC, FDR, and SDSD. Green triangles are significant by SDSD and FDR. Purple triangles are significant by SDSD but not by FDR. Black circles are significant by FDR but not by SDSD