
Fig. 3.
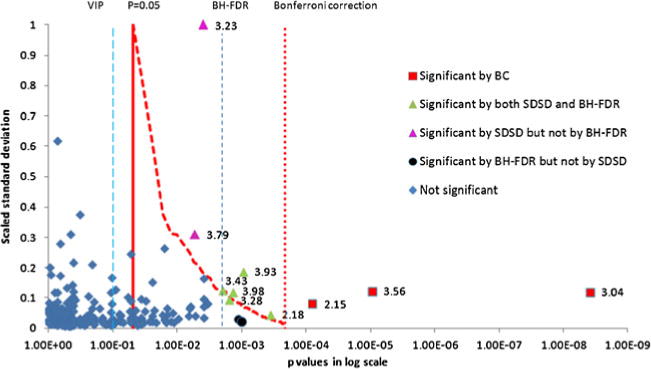
Distribution of raw bucket p values according to scaled standard deviation obtained from the C versus V comparison NMR data set. The solid red vertical line indicates the critical p value based on the significance level of α=0.05. The red dotted vertical line indicates the BC corrected critical p value. The red dashed curve shows SDSD critical values for peaks with raw p values between the significance level and the BC critical value. The y values for this curve are the normalized standard deviations for the bucket with its corresponding SDSD critical value. Red squares are significant by the BC method. Buckets with raw p values to the right of the SDSD critical values curve and to the left of the BC critical line (solid green triangles) indicate additional significant buckets identified by the SDSD method. Purple triangles are significant by SDSD but not by FDR. The resonance at 3.23 ppm belongs to O-phosphocholine and the resonance at 3.79 ppm belongs to glutamine. Black circles are significant by FDR but not by SDSD. The NMR pseudo spectra constructed from the PC1 loadings is shown in Fig. S4, Electronic supplementary material