
Fig. 4.
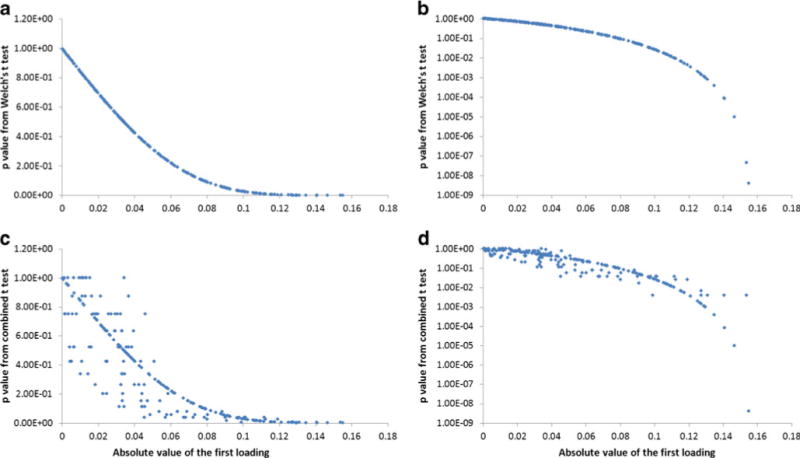
Scatter plot of p values from statistical significance analyses (group C versus group V) relative to the absolute value of the first PLS-DA loading. a Welch’s t test; b Welch’s t test with log y axis; c combined t test; d combined t test with log y axis. PLS-DA (R2X=0.759; Q2=0.554 from cross validation by SIMCA-P+ (v.11))