
Fig. 5.
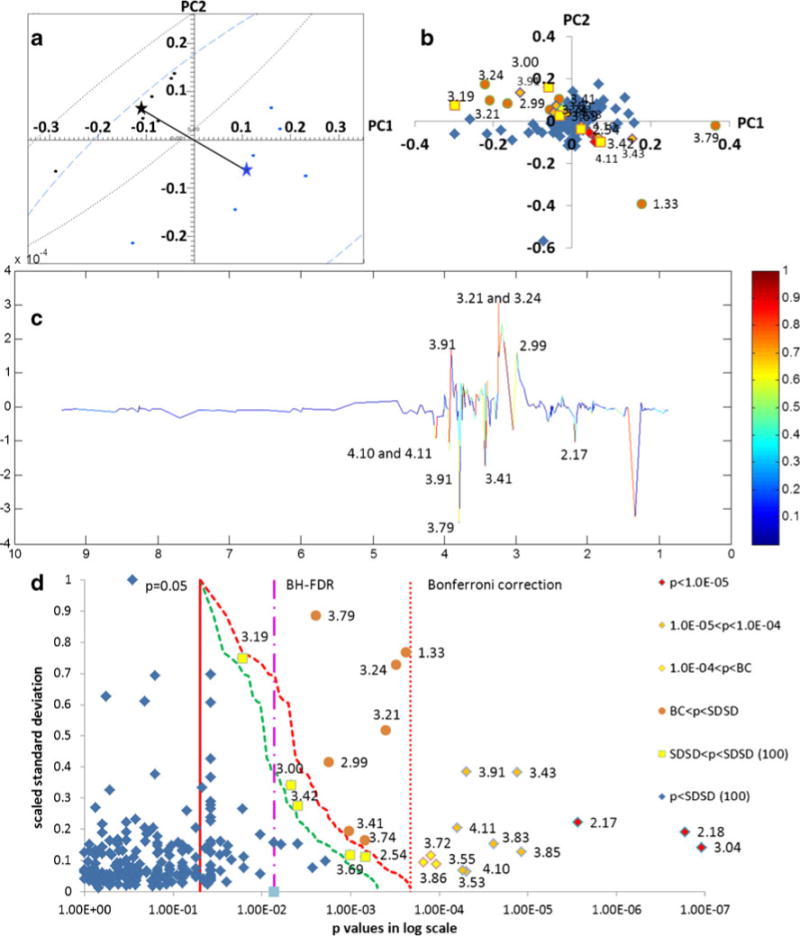
Comparison of group Aversus group V NMR-based metabonomics data using BC, SDSD, and PLS-DA. a PCA scores plot, b PCA loadings plot heat-map colored by bucket p values: red diamonds (p<10−5), orange diamonds (10−5<p<10−4), yellow diamonds (10−4<p<BC), orange circles (BC<p<SDSD correction (235 variables), and yellow squares (SDSD correction<p<SDSD (100 variables). c Loadings plot of the first latent variable from PLS-DA. d Buckets p value distribution according to scaled standard deviation. The colors and symbols of the markers are the same as in (a). The solid red vertical line indicates the critical p value base on the significance level; the dotted red vertical line indicates the BC critical p value; the dashed red line indicates the SDSD critical p value line using 235 variables; and the dashed green line indicates the SDSD critical p value line using 100 variables. The threshold for significant buckets identified by the FDR method is indicated by the pink dashed–dotted line; all buckets to the right of this critical line are significant by FDR. The NMR pseudo spectra for these data constructed from the PC1 loadings is shown in Fig. S5, Electronic supplementary material