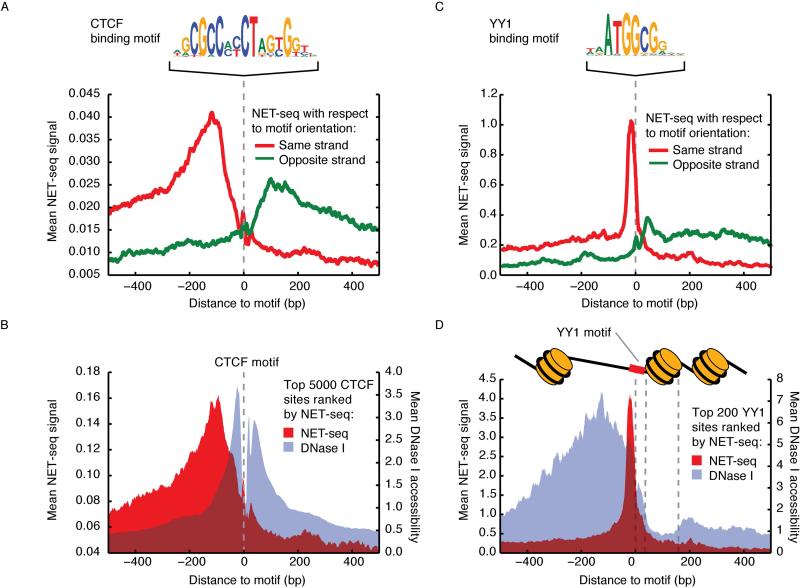
Figure 6. Pol II Pausing Associated with Transcription Factor Occupancy.
(A) Average NET-seq signal around 16,339 CTCF motifs with accessible chromatin. In red is NET-seq signal oriented to the strand of the motif (Pol II transcription from left to right) and in green is NET-seq on the other strand (Pol II transcription from right to left). The CTCF binding motif is pictured above. The NET-seq data was smoothed by a 10 bp sliding window average. (B) Mean NET-seq (red) and DNase I cleavage (gray) signal (10 bp windowed averages) surrounding the top 5,000 CTCF motifs sorted by NET-seq signal. (C) Average NET-seq signal (smoothed by a 10 bp sliding window average) around 731 YY1 motifs with accessible chromatin. In red is NET-seq signal oriented to the strand of the motif (Pol II transcription from left to right) and in green is NET-seq on the other strand (Pol II transcription from right to left). The YY1 binding motif is pictured above. (D) Mean per-nucleotide NET-seq (red) and DNase I cleavage (gray) signal surrounding the top 200 YY1 motifs sorted by NET-seq signal. Both signals are presented as 10 bp windowed averages. Schematic of nucleosome positioning relative to YY1 inferred from DNase I accessibility is above plot.

