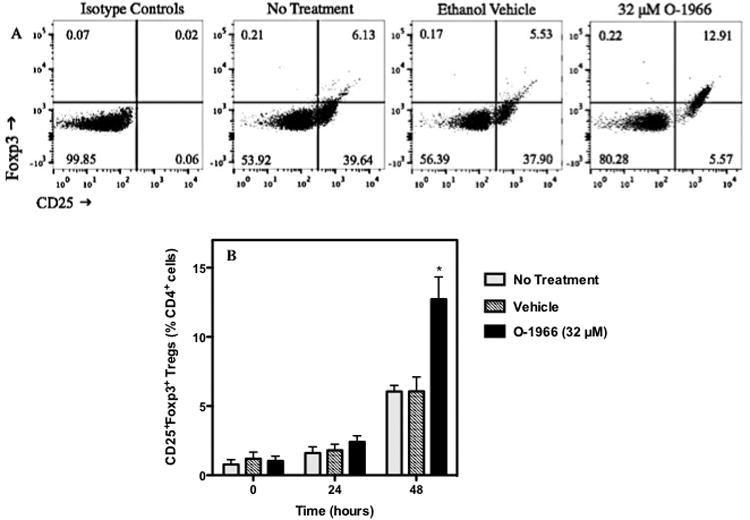
Figure 6.

O-1966 increases the percentage of Tregs in the MLR. To determine if O-1966 induces Tregs in the MLR, cultures were analyzed by flow cytometry for live (LIVE/DEAD® dead cell stain negative) CD4+CD25+Foxp3+ Tregs. Panel A shows representative scatterplots of MLR cultures harvested at 48 hours and stained with isotype controls and left untreated or pretreated with 32 μM O-1966 or ethanol vehicle, stained with antibodies for CD25 and Foxp3. The cells were gated on live CD4+ cells and are expressed as a percentage of total live CD4+ cells. Panel B shows the average number of CD25+Foxp3+ Tregs as a percentage of total live CD4+ cells from 3 experiments from cultures left untreated (
 ) or pretreated with 32 μM O-1966 (
 ) or ethanol vehicle (
 ), and harvested at time zero, or after 24 or 48 hours in culture. Data are the mean ± S.E.M. of 3 separate experiments. *p < 0.01. (ANOVA, O-1966 versus vehicle).
