Fig. 3.
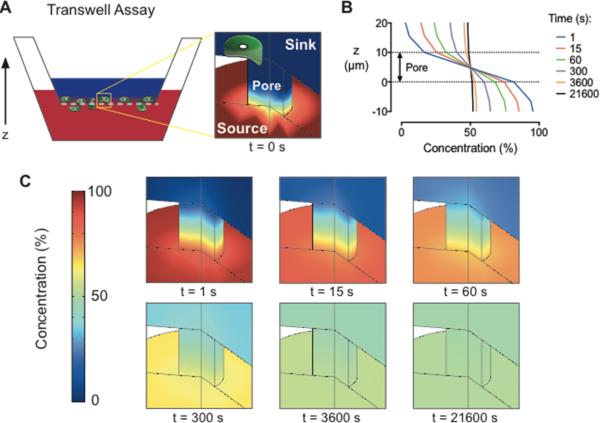
An engineering analysis of diffusion reveals significant instability of the concentration gradient within a Transwell assay. (A) Schematic diagram of a Transwell assay with the sink above the membrane and the growth factor source below the membrane. (B) Concentration gradient profiles across a membrane pore are displayed as a percentage of the initial source concentration for times between 1 – 21600 s (i.e., 1 s – 6 h). (C) Finite element simulations of the concentration gradient across a membrane pore as a function of time. Red is 100% of the initial source concentration and dark blue is 0%.

