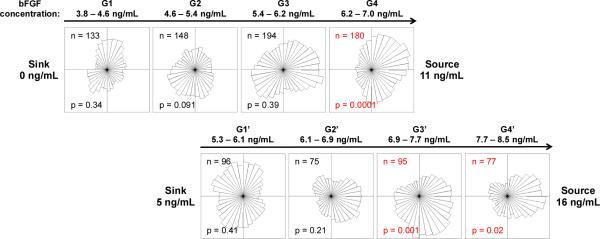
Fig. 6.

Increasing the concentration range, while maintaining the gradient slope, reveals similar chemotactic behavior in myoblasts above a threshold concentration. The top panel of angular histograms illustrates the distribution of myoblasts after exposure to the corresponding bFGF gradient for 14 h when the device source and sink are perfused with 11 and 0 ng/mL bFGF, respectively. The bottom panel illustrates the distribution of myoblasts after 14 h when the device source and sink are perfused with 16 and 5 ng/mL bFGF, respectively. The gradient slopes are identical between the top and bottom panels. The number of individual cells tracked (n), and the p-value calculated using the Rayleigh Test for Vector Data (p) are shown. Red labels denote histograms with statistically significant asymmetry (p <0.05).
