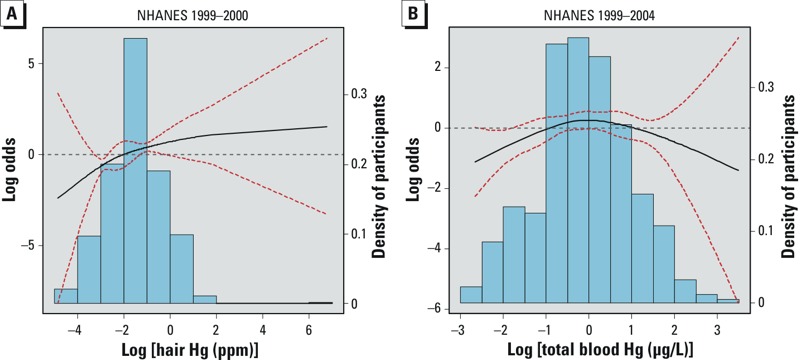
Figure 1.

Associations of antinuclear antibody (ANA) positivity with log-transformed hair and total blood mercury (Hg), adjusted for Model B covariates. (A) Hair Hg (1999–2000; n = 452). (B) Total blood Hg (1999–2004; n = 1,352). Solid black lines represent the smoothing trends estimated from the natural spline with 3 degrees of freedom (df) for hair Hg and 4 df for total blood Hg (knots at 25th, 50th, and 75th percentiles); red dotted lines represent 95% CIs; and bars represent the weighted density distribution for Hg. The dose–response relationship for both hair and total blood Hg increased in a statistically significant fashion within the lower ranges of Hg exposure.
