Fig. 2.
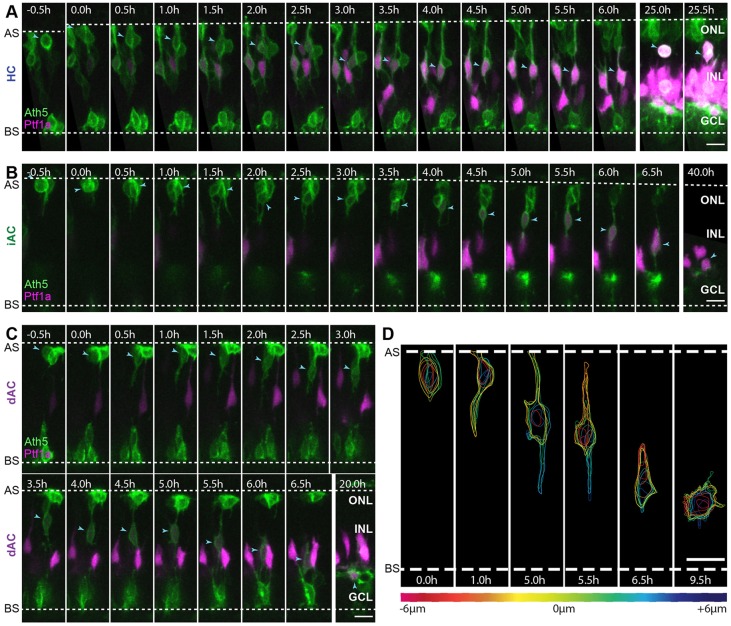
RINs transition directly into bipolar morphologies after birth. (A-C) Selected frames of movies starting at ∼44 hpf showing an HC, an iAC and a dAC (indicated by blue arrowheads) from birth. (D) Contour maps of the dAC shown in C at several time points. The dAC was traced z-slice by z-slice. Each trace was coloured based on the position of the z-slice relative to the centre of the cell. z-slices are spaced 1 µm apart. Time is shown as hours relative to cell birth. Scale bars: 10 µm. AS, apical surface; BS, basal surface; ONL, outer nuclear layer.

