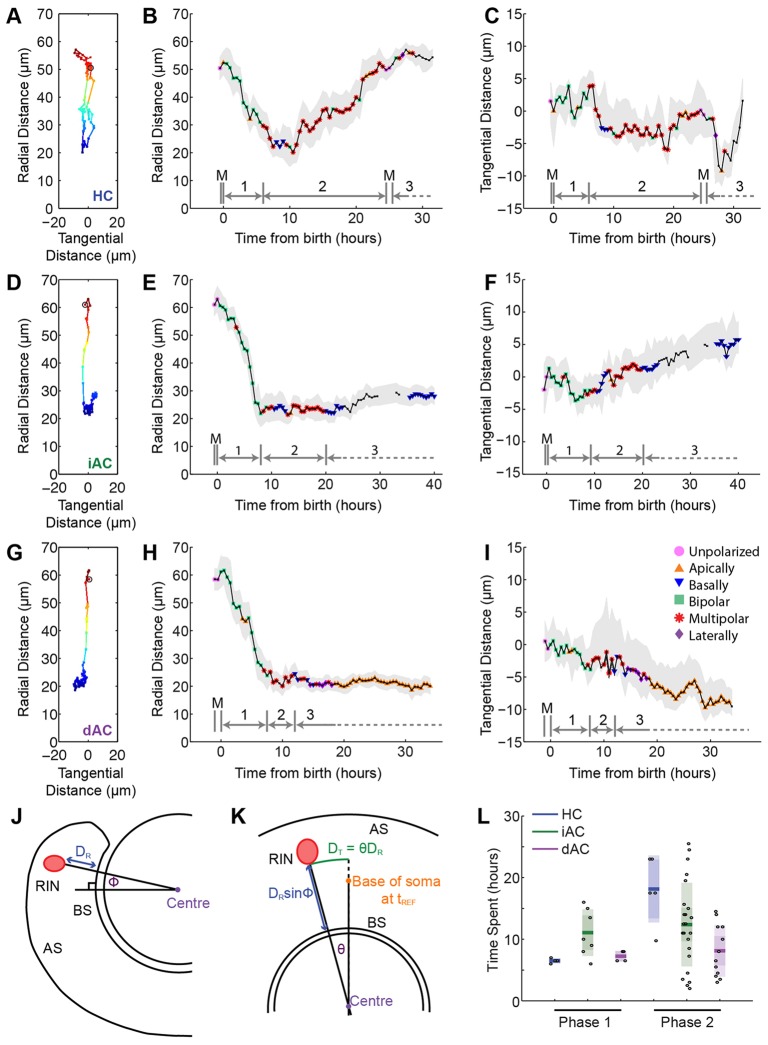
Fig. 5.
RIN migration can be separated into distinct phases. (A-I) A-C show the tracking data for the HC shown in Fig. 2A; D-F show the tracking data for the iAC shown in Fig. 2B; and G-I show the tracking data for the dAC shown in Fig. 2C. (A,D,G) Radial position of the base of the cell relative to the basal surface of the retina and tangential position of the base of the cell relative to its position at birth. The black open circle indicates the start of the track. (B,E,H) Radial position of the cell over time. The greyed area indicates the distance of the apical and basal extent of the cell soma. The black line indicates the distance of the middle of the cell soma from the basal surface. (C,F,I) Tangential position of the cell over time. The greyed area indicates the distance of the lateral extent of the cell soma. The black line indicates the position of the base of the cell soma. For B,C,E,F,H,I, different markers on the black line indicate that the cell morphology was classified at that time point. Above the x-axis, grey bars show how different parts of the track were split into different phases: mitosis (M), Phase 1 (1), Phase 2 (2) and Phase 3 (3). (J,K) Schematics of dorsal (J) and lateral (K) views of the retina, showing how a spherical coordinate system was set up and radial (DR) and tangential (DT) distances were measured (see Materials and methods). AS, apical surface; BS, basal surface. (L) Boxplot showing the mean, 95% confidence interval and one standard deviation of the time RINs spend in Phase 1 and Phase 2.

