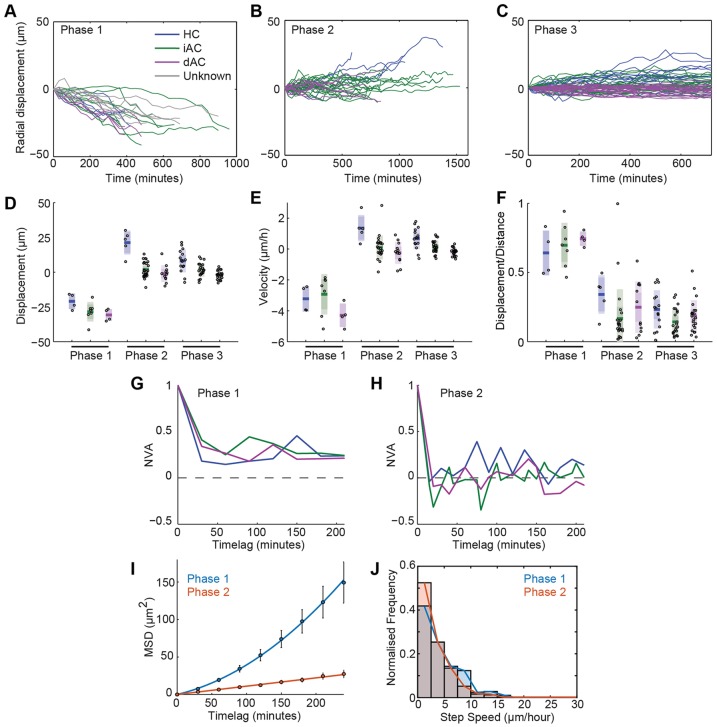
Fig. 6.
Radial migration. (A-C) Radial component of cell tracks of HCs (blue), iACs (green), dACs (magenta) and unclassified inhibitory neurons (grey) for each migration phase. (D-F) Boxplots showing the mean, 95% confidence interval and one standard deviation for displacement (D) and velocity (E) and the ratio of displacement over total distance travelled (F). (G,H) Normalized velocity autocorrelation (NVA) against time lag for Phase 1 (G) and Phase 2 (H). (I) One-dimensional MSD curves for radial migration with a diffusion-flow model fitted to Phase 1 (blue line) and a diffusion model fitted to Phase 2 (orange line). Error bars represent s.e. (J) Histogram of step-speed for Phase 1 and Phase 2.

