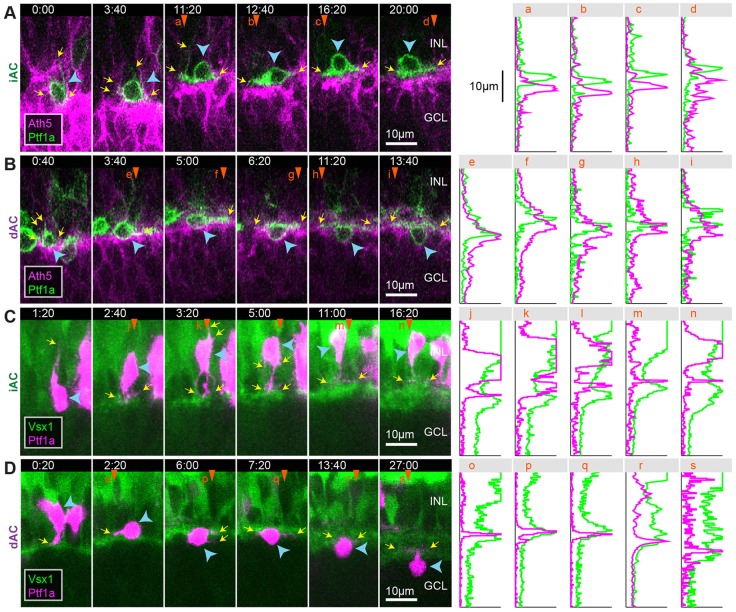
Fig. 9.
iACs and dACs differentially stratify within the proto-IPL. (A,B) Selected frames of a movie of an iAC (A) and a dAC (B) transitioning from multipolar morphology to unipolar morphology in the Ath5 background. (C,D) Selected frames of a movie of an iAC (C) and a dAC (D) transitioning from multipolar morphology to unipolar morphology in the Vsx1 background. Panels on the right indicate the intensity line profile of the corresponding vertical line marked by orange arrowheads. Yellow arrows indicate the tips of the cells' processes. Blue arrowheads indicate cell somas. Time is shown as h:min from the start of the imaging sessions, at ∼50 hpf.

