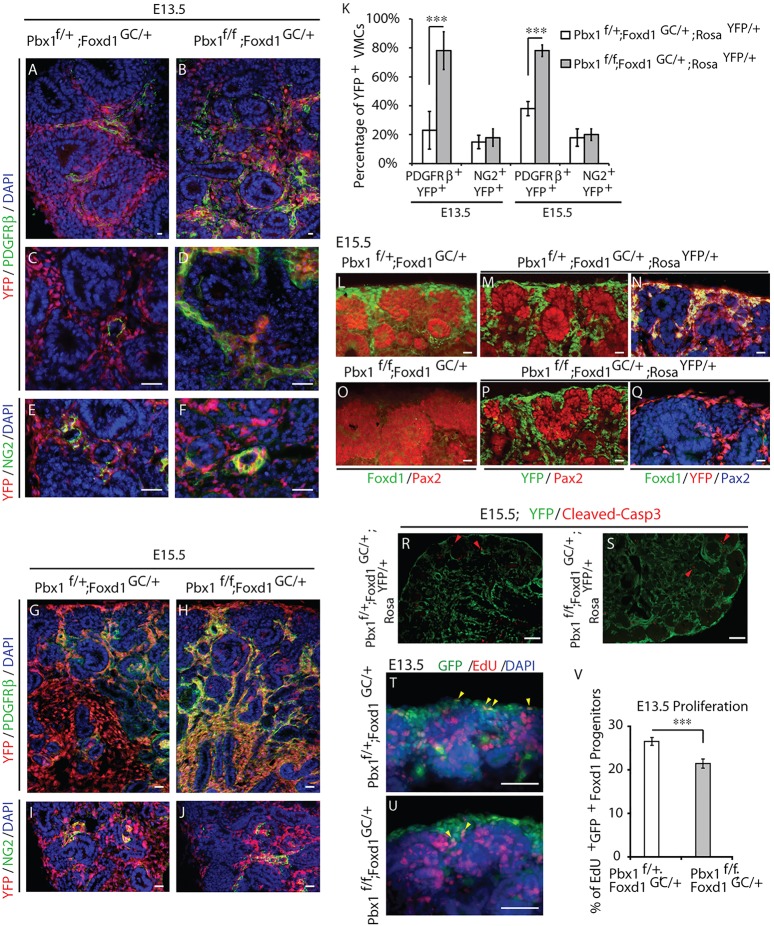
Fig. 2.
Foxd1-Cre-mediated Pbx1 excision results in ectopic and precocious upregulation of PDGFRβ in the VMC lineage and premature depletion of self-renewing VMC progenitors. (A-J) Control Pbx1f/+; Foxd1GC/+; RosaYFP/+ (A,C,E,G,I) and mutant Pbx1f/f; Foxd1GC/+;RosaYFP/+ (B,D,F,H,J) kidneys analyzed at E13.5 (A-F) and E15.5 (G-J) by IF for the detection of PDGFRβ (A-D,G,H) and NG2 (E,F,I,J). Foxd1 derivatives were identified by YFP fluorescence. Inactivation of Pbx1 in the VMC lineage results in precocious and ectopic PDGFRβ expression in VMCs. The expression of the VMC marker NG2 is not dysregulated by Pbx1 inactivation. Scale bars: 10 μm. (K) Quantification of the percentage of YFP+ Foxd1 derivatives expressing PDGFRβ or NG2 present in control Pbx1f/+;Foxd1GC/+;RosaYFP/+ and mutant Pbx1f/f;Foxd1GC/+;RosaYFP/+ kidneys at E13.5 and E15.5. n=4 embryos per genotype at each stage of development; error bars represent s.d. ***P<0.001. (L-Q) IF detection of Foxd1+ VMC progenitors in E15.5 control Pbx1f/+;Foxd1GC/+;RosaYFP/+ (L) and mutant Pbx1f/f;Foxd1GC/+;RosaYFP/+ (O) kidneys. E15.5 control Pbx1f/+;Foxd1GC/+;RosaYFP/+ (M,N) and mutant Pbx1f/f;Foxd1GC/+;RosaYFP/+ (P,Q) kidneys processed by IF for the detection of Pax2 (L-Q) and Foxd1 (L,N,O,Q). Foxd1-derived cells were identified by YFP fluorescence (M,N,P,Q). Self-renewing Foxd1+ VMC progenitors are prematurely depleted in mutant Pbx1f/f;Foxd1GC/+;RosaYFP/+ kidneys (O). Scale bars: 10 µm. (R,S) Analysis of apoptosis by IF of cleaved caspase 3 in control Pbx1f/+;Foxd1GC/+;RosaYFP/+ and mutant Pbx1f/f;Foxd1GC/+;RosaYFP/+ E15.5 kidneys (n=2 per genotype). Red arrowheads indicate apoptotic cells, which were all YFP−. Scale bars: 50 µm. (T,U) Fluorescence detection of proliferating EdU+ self-renewing Foxd1+ progenitors in E13.5 kidneys (yellow arrowheads). Scale bars: 50 µm. (V) Mean percentages of EdU-incorporating Foxd1-GFP+ cells in control E13.5 Pbx1f/+;Foxd1GC/+ and mutant Pbx1f/f;Foxd1GC/+ kidneys. (n=3 embryos per group), error bars represent s.e.m. ***P=0.0008. See also supplementary material Fig. S2.

