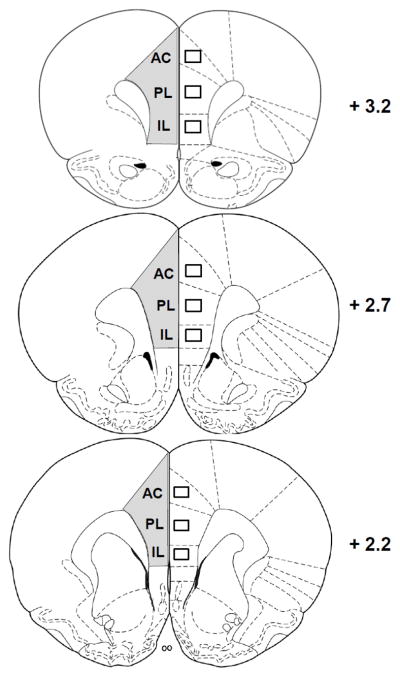
Figure 2.

Regions within the mPFC assessed with stereology (gray area, left hemisphere), and density counts within the subregions AC, PL, and IL (right, boxes). Numbers indicate distance from bregma according to the atlas of Paxinos and Watson (1998).
