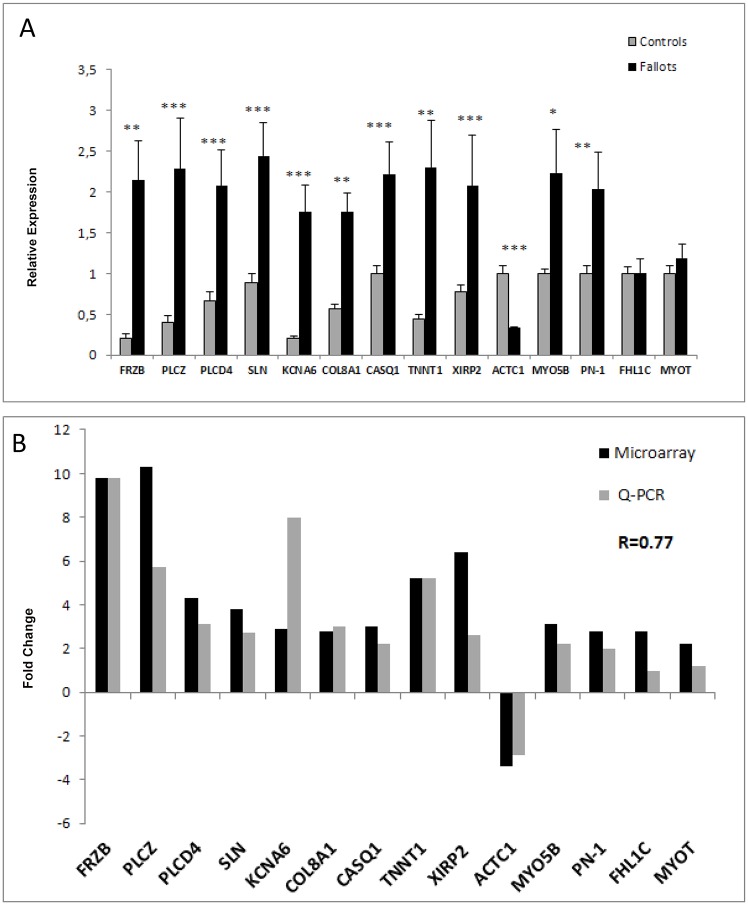
Fig 5.
A. Relative expression (RT-qPCR) of genes in samples from the RV Endocardium of controls (grey bars) and rTOF (black bars) hearts. Transcript expression is normalized to the reference genes HPRT1 and GUSB. Two sided T-Test Statistical significance of n = 5 Controls and n = 7 rTOF hearts (*P <0.05, **P <0.01, ***P <0.001) B. Fold change comparison in samples from the RV Endocardium (n = 5 Controls and n = 7 rTOF hearts) based on RT-qPCR results and microarray expression data. Pearson correlation coefficient R = 0.77 (p = 0.001).

