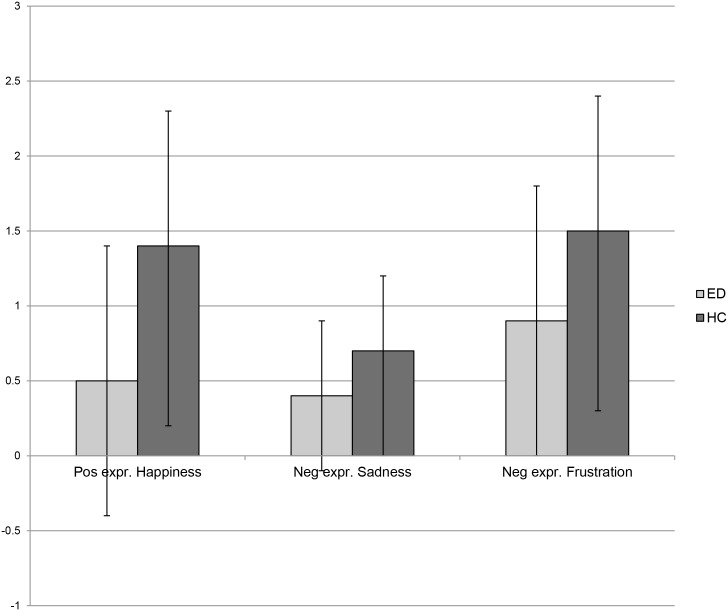
Fig 2. Frequencies of positive and negative facial expressions shown by participants with Eating Disorders and Healthy Controls.
Mean frequencies of positive facial expressions shown in response to happy displays and negative facial expressions shown in response to negative displays (i.e. sadness and anger) in participants with Eating Disorders (EDs) and Healthy Controls (HCs).

