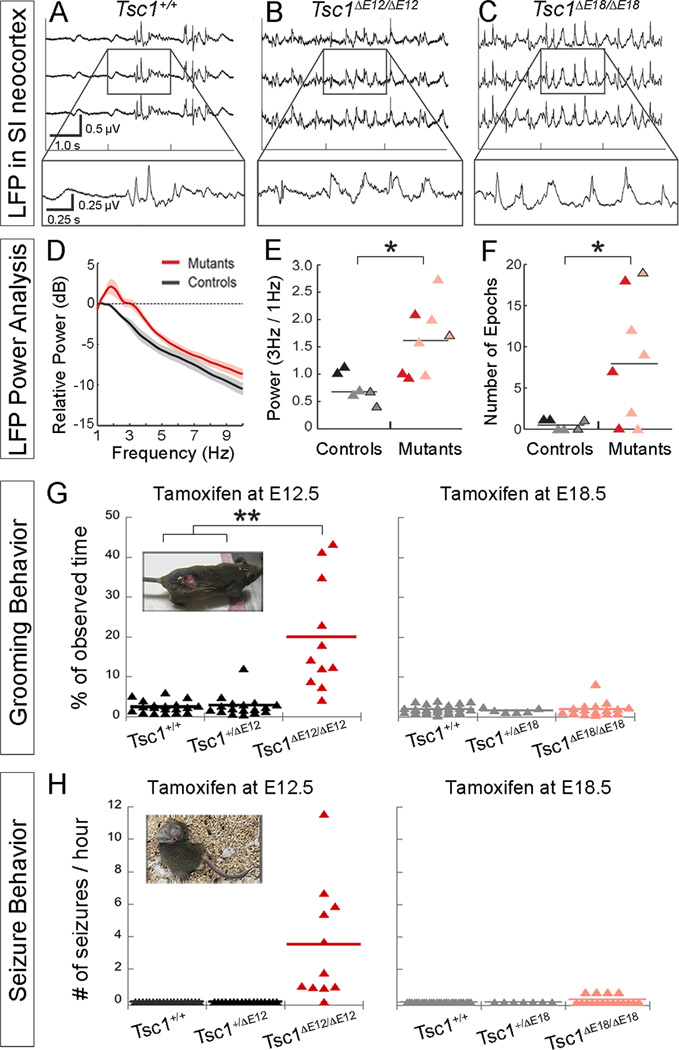
Figure 7. Abnormal brain activity and behaviors caused by thalamic Tsc1 deletion.
(A–C) LFPs in primary somatosensory neocortex were altered in Tsc1ΔE12/ΔE12 and Tsc1ΔE18/ΔE18 mutants. (D) Average power spectra of mutants and controls (E12.5 and E18.5 experiments were pooled together) shows increased power between 2–4Hz. Lines and shading represent mean ± SEM (E) 3Hz power was normalized to 1Hz power for controls (black, E12.5; gray, E18.5) and mutants (red, Tsc1ΔE12/ΔE12; pink, Tsc1ΔE18/ΔE18). Data points with black outlines represent recordings performed on aged animals (>8 months). (F) ≥20-second epochs of high-power 3Hz activity are plotted. (G) The percentage of time spent grooming is plotted by genotype. E12.5 and E18.5 graphs share a y-axis. Inset: A Tsc1ΔE12/ΔE12 mouse that developed a wound from over-grooming (H) Number of seizures per hour of observation time is plotted by genotype. E12.5 and E18.5 graphs share a y-axis. Inset: Contorted posture typically observed during seizures. *p<0.05, **p<0.005. See also Figure S6.

