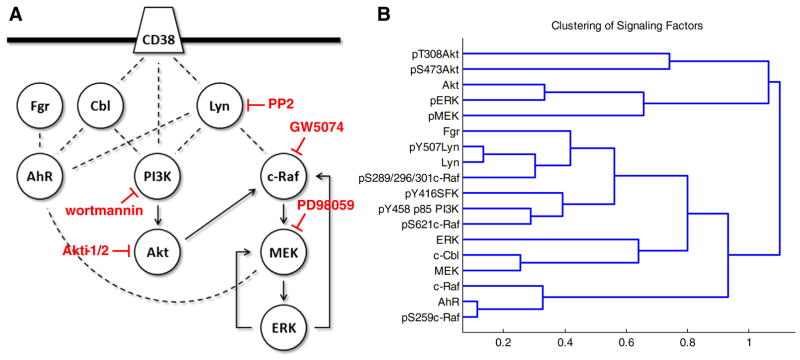
Fig. 2.

Signaling network of factors investigated in this study and hierarchical clustering. (A) Simplified diagram of the interactions and functional relationships between the proteins investigated in this study, curated from literature: Bunaciu and Yen 2013 Mol Can; Bunaciu et al. submitted; Yim et al. 2004 Biochem Biophys Res Commun; Congleton et al. 2012 Leukemia; Congleton et al. 2014 Cell Signal; Bunda et al. 2014 Oncogene; Dhillon et al. 2007 Oncogene; Steelman et al. 2011 Aging; Zimmermann and Moelling 1999. The targets affected by the inhibitors used in this study are indicated. (B) Repeat Western blot data was quantified using ImageJ and subject to hierarchical clustering analysis using the Pearson correlation coefficient as a distance metric and an average linkage method (see Section 2). Data includes both cytoplasmic and nuclear signaling factor expression and phosphorylation for wild-type (Supplemental figs. S2–7), R38+ (Supplemental figs. S2–7) and R38− (Supplemental figs. S2–7) treated with 1 μM RA or RA combined with 2 μM PD98059, 2 μM GW5074, 1 μM wortmannin, 1 μM Akti-1/2 or 10 μM PP2. Distances between clusters (1 — Pearson correlation coefficient) are indicated on the x-axis.
