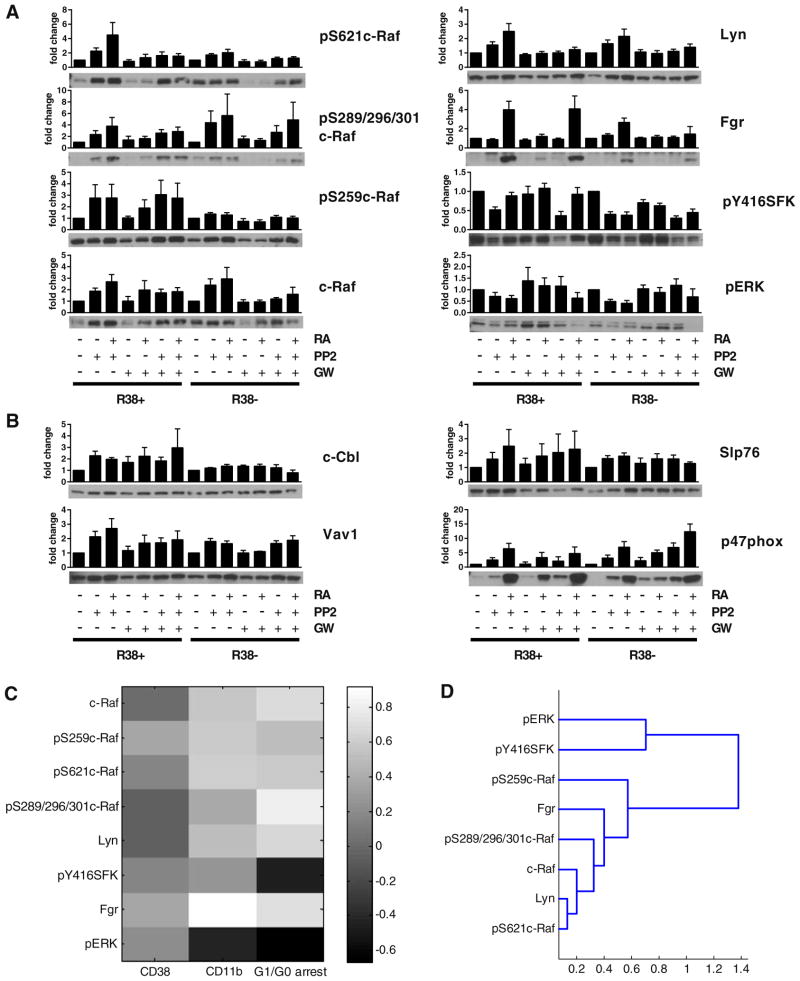
Fig. 4.
Quantified signaling factor expression during combined GW5074, PP2 and RA treatment and correlation analysis. 48 h Western blot data (at least three repeats) of total lysates were quantified using ImageJ and fold change to respective R38+ or R38− control calculated. Error bars represent standard error. p-value analysis cannot be performed on quantified blot data, which is nonlinear. Instead a representative blot is displayed beneath each graph. GAPDH loading controls were performed to ensure even loading (not shown). (A) Signaling factors for c-Raf and Src-family kinase events and activated ERK were assessed for R38+ or R38− cell treated with PP2, PP2 + RA (reported previously in [25]), GW5074 (GW), GW + RA, PP2 + GW and PP2 + GW + RA. Since quantified data is estimated from immunoblot images in which signal detection may or may not have been in the linear range, p-value analysis is not applicable to quantified blot data. (B) Signaling factors for CD38-associated factors c-Cbl, Vav1 and Slp76, the p47phox protein. (C) Pearson correlation coefficient matrix between MAPK and Src-family kinase signaling factor events from Fig. 4A and phenotypic results from Fig. 3A, i.e. for R38+ and R38− across treatments with PP2, PP2 + RA, GW5074, GW5074 + RA, PP2 + GW5074 and PP2 + GW5074 + RA. Colorbar: white (1) indicates positive correlation, mid-gray (0) indicates no correlation, black (−1) indicates negative correlation. (D) Hierarchical clustering analysis of data presented in Fig. 4A using the Pearson correlation coefficient as a distance metric and an average linkage method (see Section 2). Distances between clusters (1 — Pearson correlation coefficient) are indicated on the x-axis.

