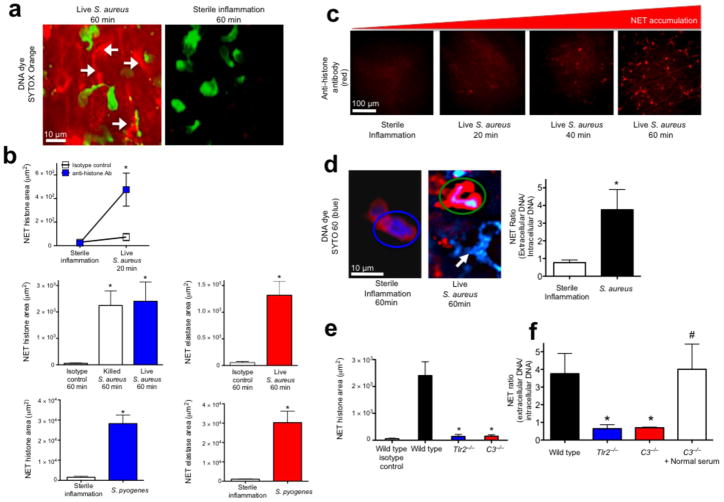
Figure 1.
Rapid in vivo NETosis during acute Gram-positive bacterial infections is directly visualized in vivo. (a) Method 1: NET release was visualized as extracellular DNA (SYTOX Orange, white arrows) in vivo during infection (S. aureus, Xen29), but not during sterile inflammation (MIP-2 superfusion) (neutrophils are green, while NETs are red)(6 mice). (b) Method 2: NET quantification using fluorochrome conjugated histone or neutrophil elastase specific antibodies following live S. aureus, S. pyogenes or killed bacteria (S. aureus Xen8.1). Control animals received fluorochrome conjugated IgG isotype control (n = 4 for each group, n = 3 for dead bacteria). (c) Temporal NET tissue accumulation with PMN images removed for clarity of NETs. (d) Method 3: In vivo PMN nuclei pre-stained with the cell-permeable DNA dye (SYTO 60, blue) during sterile inflammation (left) or during infection with GFP-S. aureus (GFP-USA300)(right). A PMN with a normal nucleus is circled in blue, while a PMN with a diffuse nucleus is circled in green. NETs are demonstrated during infection with a white arrow. NET release is quantified by a ratio of extracellular DNA to intracellular DNA. (e) Impaired histone release in Tlr2−/− and C3−/− animals (n = 3 each group). (f) Impaired DNA release in wild type, Tlr2−/− and C3−/− mice (n = 3 for all groups). NET area was determined using Volocity imaging software (* = P < 0.05 for treatment versus control, or treatment versus sterile inflammation, or knockout versus wild type, # = P < 0.05 for treatment versus C3−/−).

