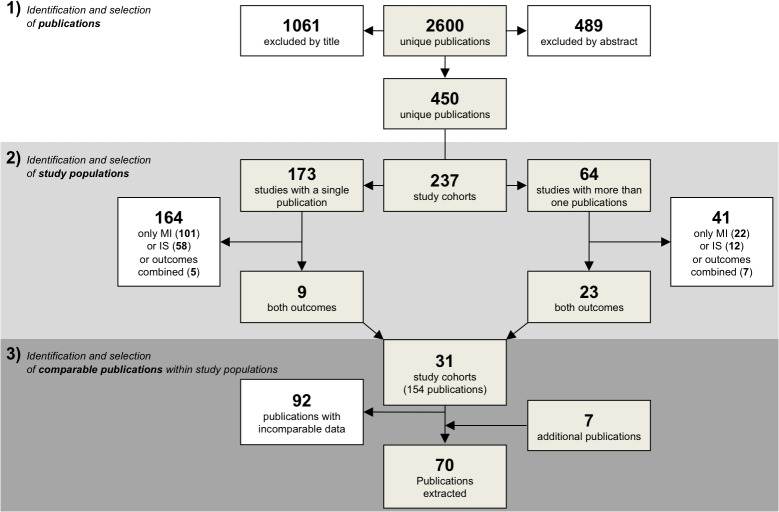
Fig 1. Flow chart of the steps of data collection.
The figure shows the three steps in the data collection: (1) identification of publications which report on the effect of measures of hypercoagulability and the risk of myocardial infarction (MI) or ischaemic stroke (IS) (2) identification of study populations (3) identification of publications with comparable data. Comparable data can be found in the same publication or in two different publications.

