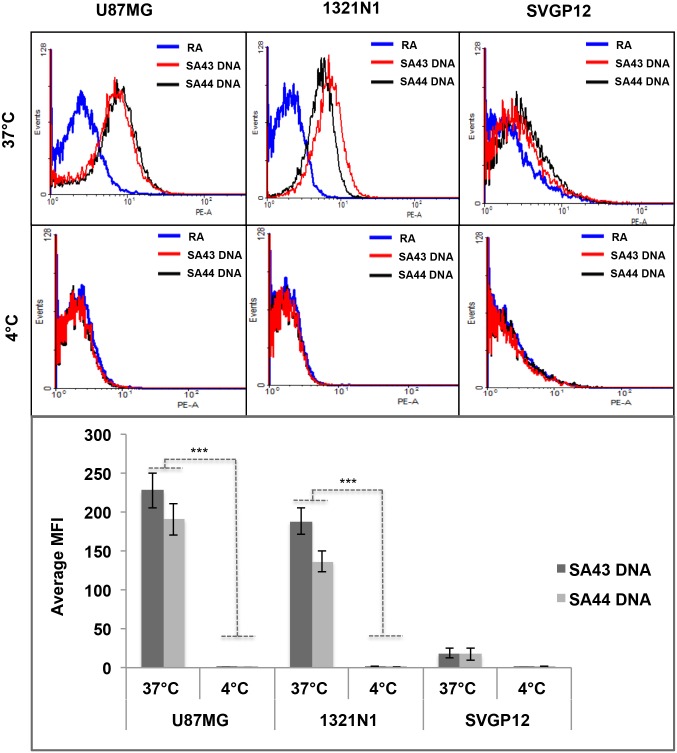
Fig 5. Representative flow cytometry profiles and comparative uptake showing temperature dependent uptake of SA43 and SA44 DNA.
Cy3 labelled SA43, SA44 aptamers and random aptamer (RA) (100 nM) were incubated separately with live U87MG, 1321N1 and SVGp12 cells at 37°C (5% CO2) or 4°C for 90 minutes. The blue curve represents the background mean fluorescence intensity (MFI) of the random aptamer. The red and black curve represents the MFI (uptake) of the cells treated with SA43 and SA44 aptamer, respectively. A, B and C represent uptake of SA43 and SA44 aptamers on U87MG, 1321N1, and SVGp12 cells, respectively at 37°C. D, E and F represent negligible uptake of SA43 and SA44 aptamers on U87MG, 1321N1 and SVGp12 cells, respectively at 4°C. G is a bar chart showing comparative uptake of SA43 and SA44 aptamers. The background MFI values for the random aptamer (control) on corresponding cells were subtracted. Statistical significance of the differences in MFI values of SA43 and SA44 aptamers confirm the high uptake by U87MG and 1321N1 cells at 37°C compared to 4°C by a two way ANOVA test (*** = p < 0.001). All experiments were repeated at least three times. Data are mean of three independent samples; bars, SEM.

