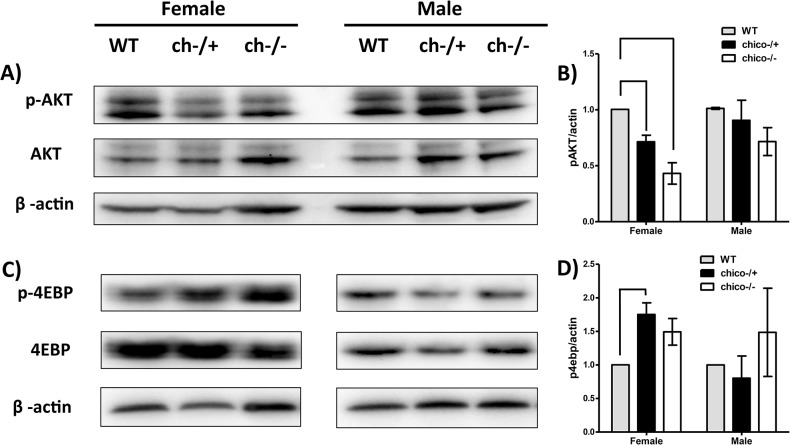
Fig 5. Abundance of AKT, pAKT, 4E-BP and p4E-BP in whole adults of each chico genotype.
A) and C) Western blots with actin loading control. B) and D) Means (s.e.) from quantified replicate blots (n = 3) relative to actin within each matched sample. Significant differences (ANOVA, post hoc test) indicated by brace-lines: p < 0.05.

