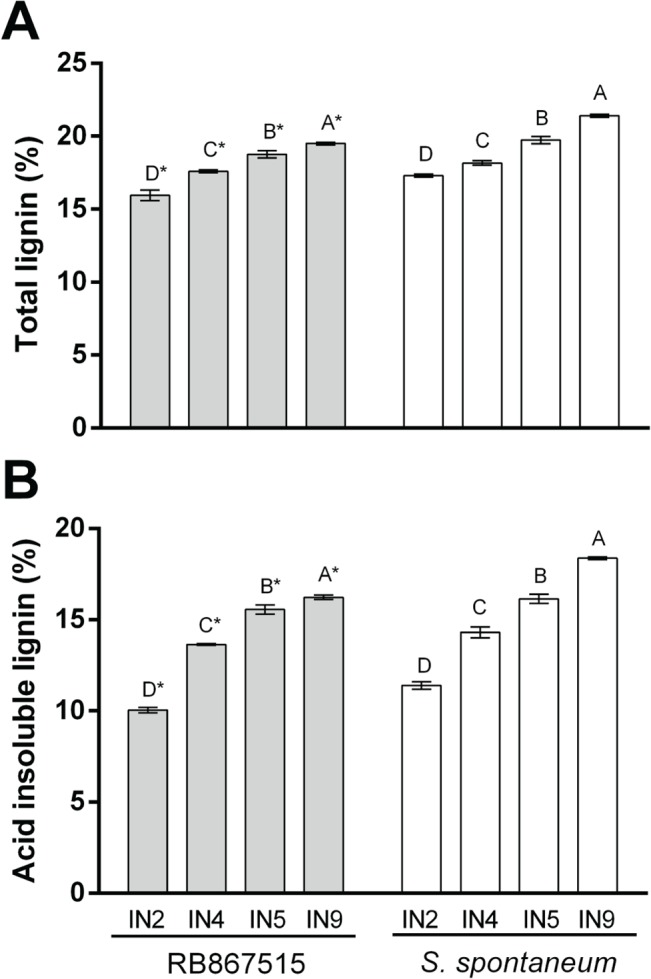
Fig 3. Lignin content of dry cell wall from RB867515 (RB) and S. Spontaneum (AG) internodes throughout development.

(A) total lignin (%) in internodes (IN2, IN4, IN5, IN9) from RB867515 (grey bars) and S. spontaneum (white bars). (B) acid insoluble lignin (%) in internodes (IN2, IN4, IN5, IN9) from RB867515 (grey bars) and S. spontaneum (white bars). Bars with common letters were not significantly different (Tukey test, p<0.05). Asterisks indicate a significant difference (t-test, p<0.05) between same internode. Error bars indicate SE of technical replicates of a pool of biological samples (n = 3).
