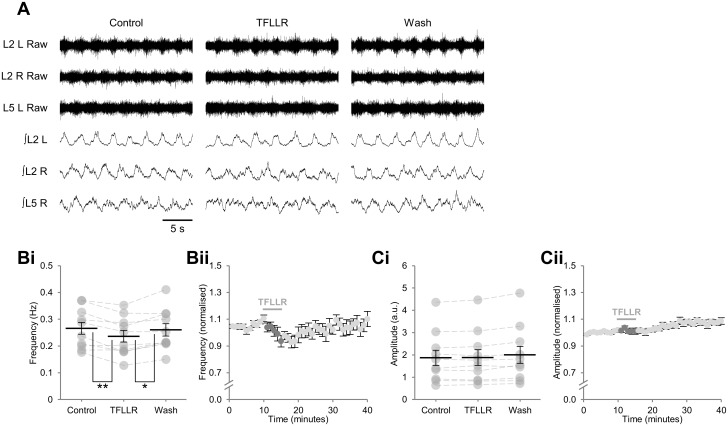
Fig 2. Stimulation of glia during ongoing locomotor-related activity results in a transient reduction in burst frequency.
A: raw (top) and rectified/integrated (bottom) traces recorded from left (L) and right (R) L2 ventral roots and the right L5 ventral root showing the effect of the PAR1 agonist TFLLR (10 μM). Bi: locomotor-burst frequency over 3 min during a control period, immediately following TFLLR application, and following a 20-min washout period. Individual data points are shown in grey and means are represented by black lines. Bii: time course plot of normalised data aggregated into 1-min bins showing a reduction in burst frequency upon application of TFLLR. Ci: locomotor-burst amplitude over 3 min during a control period, immediately following TFLLR application, and following a 20-min washout period. Cii: time course plot of normalised data aggregated into 1-min bins showing no change in burst amplitude upon application of TFLLR. n = 10 preparations. Statistically significant differences in pairwise comparisons: *p < 0.05, **p < 0.01.

