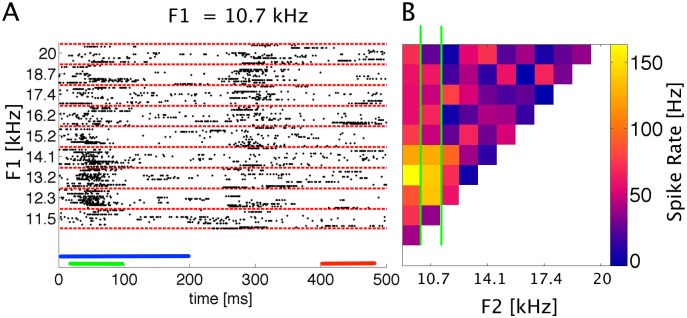
Fig 2. Construction of FRFs from spike times.

A: Raster plot of spike responses to two formant stimuli with constant F1 of 10.7 kHz and F2 as indicated on the left. Each dot shows the timing of one action potential, each row of dots the response to one stimulus. Bars: blue = stimulus (200 ms), green = onset window (20–100 ms), red = baseline window (400–480 ms). Fifteen responses are shown for each stimulus (demarcated by the red dashed lines). B: Formant receptive field constructed by averaging spike rates in the onset response time window (20–100 ms). Color coded response values are mean spike rates in the onset window in Hertz. The column of data demarcated by the green lines (F1 = 10.7 kHz) was constructed from the raw spike data shown in A. Note that panels A and B share the same abscissa.
