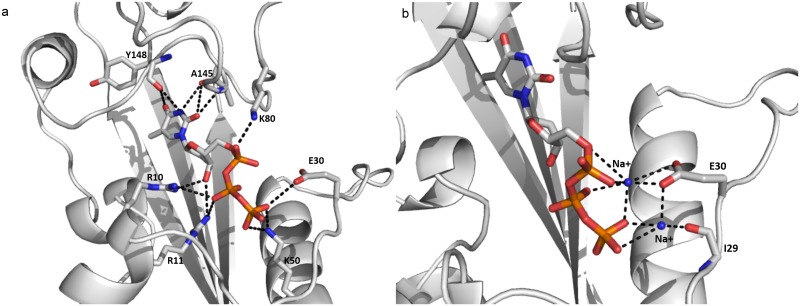
Fig 8. Average conformation of the YhdE closed state with dTTP bound in MD simulation (a) and the YhdE open state with dTTP bound in MD simulation (b).
The diagram on the left shows the interactions between dTTP and YhdE residues in the binding pocket. The diagram on the right shows two sodium ions that interact with dTTP and I29, E30 at the same time in the MD simulation.

