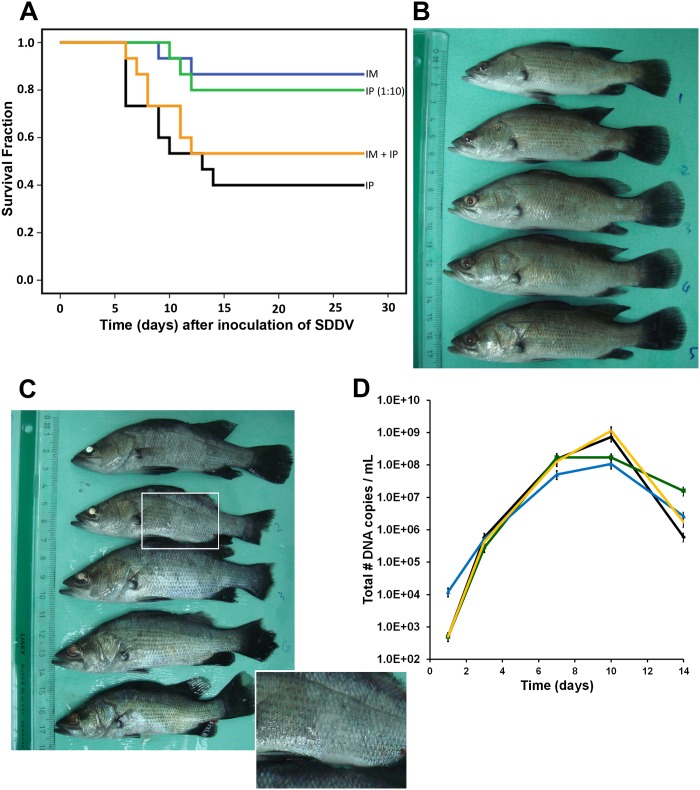
Fig 4. Inoculation of SDDV in Lates calcarifer.
(A) Kaplan-Meier survival curve of infected fish with 5x10⁶ TCID50/fish (IP—black line) or 5.5 x10⁵ TCID50/fish (IM—blue line) or both (IP + IM—yellow line). IP (1:10; green line) dose equaled 5.5 x10⁵ TCID50/fish. (B) Control fish at day 10; (C) SDDV-infected fish (IP-high dose) at day 10 after infection. Note the fin erosion, tail erosion, body color variations, white or less mucus (inset), and changes in eye color. (D) SDDV genome copy number in serum of the fish on day 1, 7, 10, and 14 after infection. Diamond—black line: IP (mortality 60%); Triangle—blue line: IM (mortality 13%); Single cross—yellow line: IP + IM (mortality 47%); Square—green line: IP 1:10 (mortality 20%).

