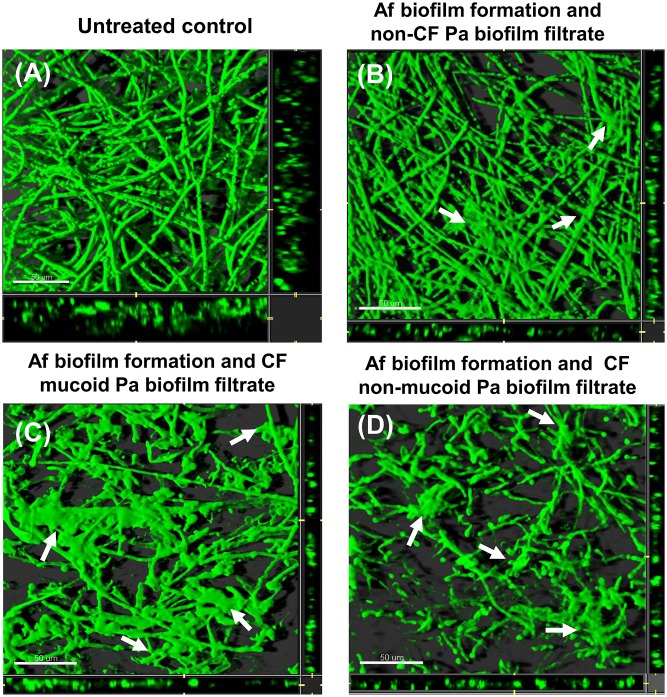
Fig 5. CLSM images of Af biofilm after challenging conidia for 16h with biofilm Pa spent supernatant.
Horizontal (xy) view of reconstructed 3-dimensional images of FUN1-stained biofilms, with filter set to capture green fluorescence. Thickness of the biofilm can be observed in the side view of the reconstruction (extreme right and lower panels in each picture). (A) Untreated control. (B) Af conidia exposed to spent supernatant of a non-CF Pa grown as biofilm for 16 h, or (C) exposed to mucoid CF Pa biofilm spent supernatant or (D) exposed to non-mucoid CF Pa biofilm spent supernatant. Arrows show “bulge-like” structures and deposition of amorphous material in treated cultures. Magnification, ×63. Bar, 50 μm.

