
Fig 8. Funnel plot analysis of potential publication bias (for the seven articles seen in Fig 7).
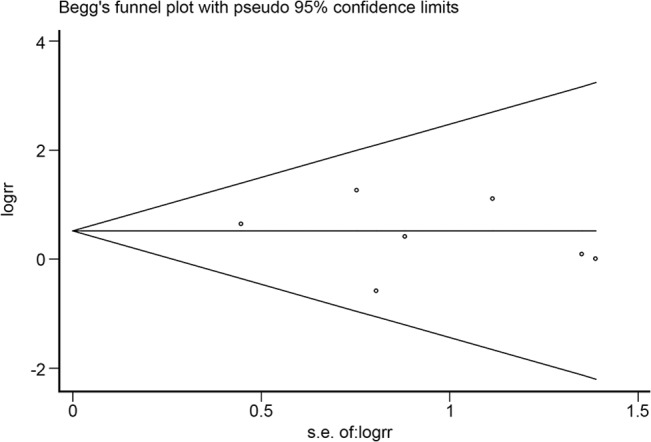
The funnel plot was symmetrical, as seen in Fig 8, and the P-value calculated by Begg’s test was 0.368.
Official websites use .gov
A
.gov website belongs to an official
government organization in the United States.
Secure .gov websites use HTTPS
A lock (
) or https:// means you've safely
connected to the .gov website. Share sensitive
information only on official, secure websites.
The funnel plot was symmetrical, as seen in Fig 8, and the P-value calculated by Begg’s test was 0.368.