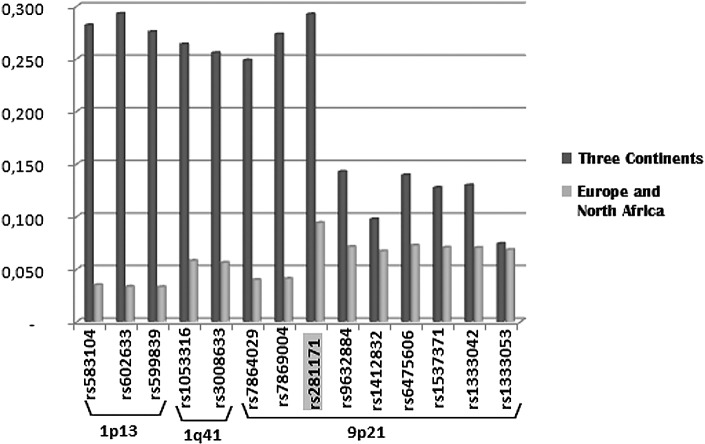
Fig 5. Plot of FST values of the markers under potential positive selection found in the FST vs heterozygosity analysis.
On the left markers found only in the context of the three continents, on the right markers found only in Europe and North Africa and in the middle (grey) the SNPs identified in both analyses.

