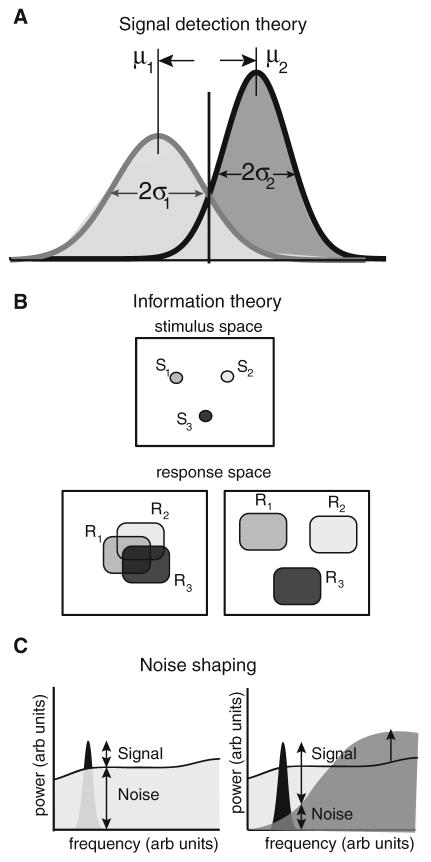
Fig. 4.
Illustration of signal detection theory, information theory, and noise shaping. a Illustrating signal detection theory. The basic premise is that two different stimuli (1 and 2) will elicit two different response distributions with means μ1, μ2 and standard deviations σ1, σ2, respectively. The degree of separability between the two distributions can be assessed by computing d′. b Illustrating information theory. Information theory can be seen as a generalization of signal detection theory for more than 2 stimuli. It is assumed that different stimuli (S1, S2, S3) will elicit different response distributions (R1, R2, R3). If these have considerable overlap (bottom left panel), it is more difficult to know whether a given response was elicited by a given stimulus. In contrast, when these response distributions have no overlap, it then becomes easy to gain information as to which stimulus was presented when observing a given response. c Illustrating noise shaping. Shown are the power spectra of a signal (black) and the noise (gray). The signal-to-noise ratio (SNR) is then simply the ratio of signal and noise power and depends on frequency. If the noise power is high, then the signal-to-noise ratio is low (left). However, if noise power was to be transferred from frequencies contained in the signal to higher frequencies, then the SNR would be increased (right). Noise shaping is precisely the transfer of noise power from one frequency range to another, thereby conserving the total noise power (i.e. the power summed overall frequencies)

