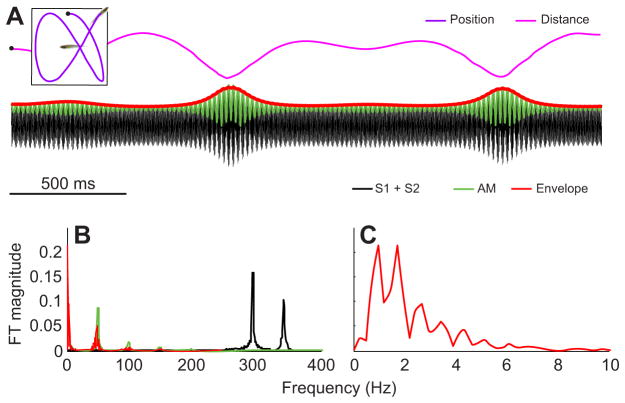
Fig. 2.
Envelope generated by the relative movement of two weakly electric fish. (A) The movement trajectories of two individual fish where fish 1 is stationary and fish 2 is swimming (purple) is shown in the inset box. The distance (magenta) between individuals varies over time as a function of the movement of fish 2. The combined signal (black) is the sum of the EOD signal of fish 1 (S1; 300 Hz) and the EOD of fish 2 (S2; 350 Hz). This combined signal has an emergent amplitude modulation (green) and higher order envelope (red). Note that the black dots show the position of fish 2 (inset) and the distance between the two fish at time 0, respectively. (B) A Fourier transform (FT) analysis shows the power (i.e. the modulus squared of FT) for each of the signals – the combined signal (black), the AM (green) and the envelope (red). (C) A close-up of B, highlighting the power at low frequencies in the envelope due to the relative movement of the fish.

