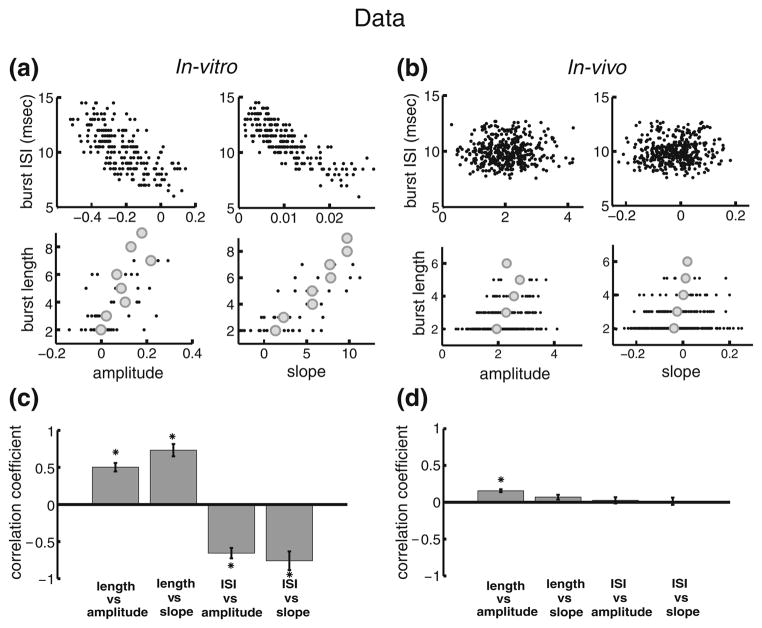
Fig. 2.
Burst coding is different in vitro and in vivo. (a): Plots of burst attributes versus stimulus attributes in vitro. The panels show the: burst ISI vs. amplitude, upper left; burst ISI vs. slope, upper right; burst length vs. amplitude, lower left; burst length vs. slope, lower right. (b): plots bursts attributes versus stimulus attributes in vivo. The panels show the: burst ISI vs. amplitude, upper left; burst ISI vs. slope, upper right; burst length vs. amplitude, lower left; burst length vs. slope, lower right. (c): in vitro population averages (n=6) of the correlation coefficients for each of the plots in panel A. (d): in vivo population averages (n=13) of the correlation coefficients for each of the plots in panel B. “*” indicates statistical significance at the P=0.01 level using a signrank test

