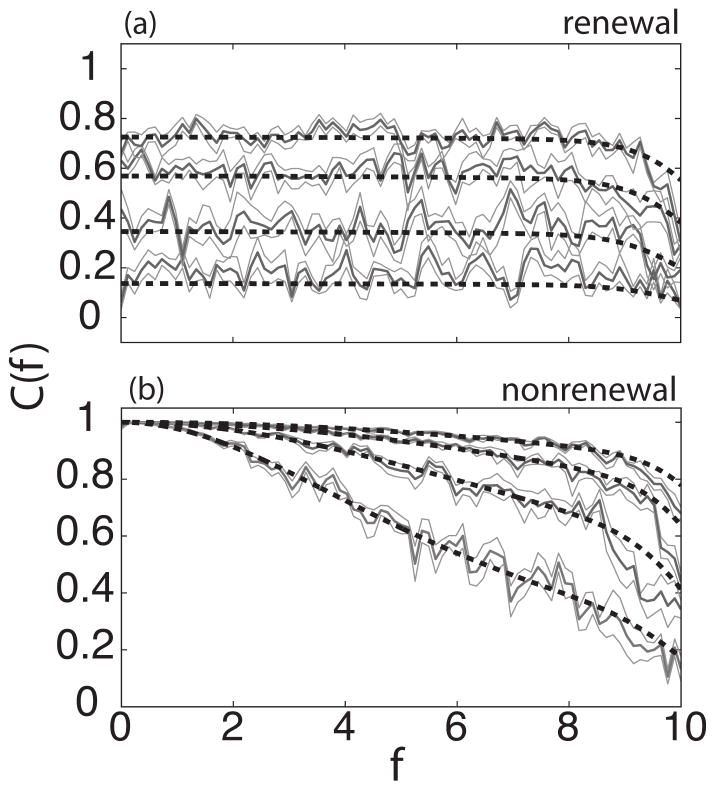
FIG. 2.
Coherence C(f) as function of frequency f for different values of the network size N with renewal (a) and nonrenewal (b) neurons. In both panels the number of neurons from bottom to top: 3,10,25,50 neurons. Solid color shows simulation and dashed line the theory. Dark gray represents the mean from ten trials surrounded in light gray by the standard error. The parameter values are as follows: θ0 =4, d =0.7, τs =0.001, fC =10, μ=290, I=5, K=0.

