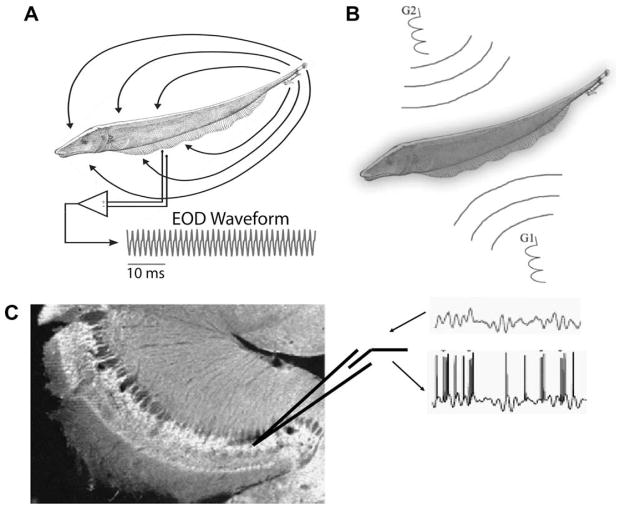
Fig. 1.
Recording and stimulation protocols. (A) Weakly electric fish generate an electric field around their body in order to electrolocate objects and for communication with conspecifics. For Apteronotus leptorhynchus, the EOD waveform recorded at one point in space is quasi-sinusoidal with a frequency of 600–1000 Hz. (B) Illustration of the Global stimulation geometry used. Amplitude modulations of the animal’s own EOD are delivered via two silver/silver-chloride electrodes (G1 and G2) located 19 cm away on each side of the animal. The perturbations of the EOD created are roughly spatially homogeneous on the animal’s skin surface. (C) Illustration of the in vitro stimulus preparations. AMs similar to those presented in vivo are translated to intracellular stimuli and used to drive pyramidal cells in vitro. Arrows indicate the presentation of an intracellular current stimulus and the recording of the spike train. These can then be analysed in a fashion similar to the in vivo recordings. DC current steps can also be applied.

